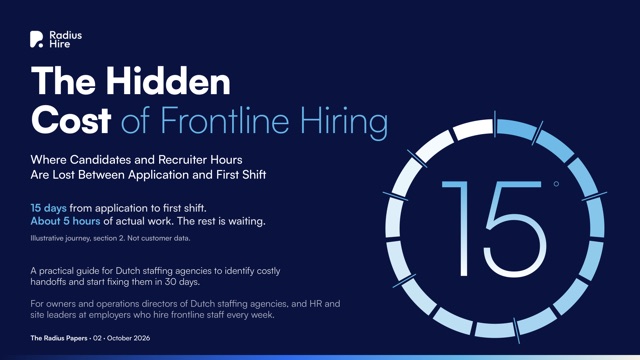

Short answer: There is no reliable average cost of slow hiring, so build your figure from your own records. Add three losses no single report shows: repeated work, candidates lost after a good screening call, and the cost of vacancy, which in this model means shift days left empty by late starts, priced at the extra cost of covering each shift. In one invented example, with every input assumed, that comes to €73,680 a year for one site.
To price the seat itself as well as the delays, see The Cost of a Frontline Hire in the Netherlands: A Model Using Your Own Figures.
Key takeaways
- The cost of slow hiring sits in three budgets: recruiter hours, replacement hiring and the client's overtime bill. No single report adds them up.
- The model needs four inputs you already track: repeated work, avoidable drop-outs, late starts and escalations, each times a price.
- Price a late start, the cost of vacancy line, as the extra cost of covering the shift, not the starter's full wage.
- Count each cost once, compare like periods, and price one fix at a time.
- The worked example is an illustration with assumed inputs. It is not a benchmark, a forecast or a customer result.
On this page: What exactly are you putting a price on? · Why does no report show the cost of hiring delays? · How do you calculate the cost of vacancy and slow hiring? · What does the worked example look like? · Is €73,680 the cost of a hire? · How do you put in your own figures? · What rules keep the figure honest? · How do you show whether a fix paid off? · What does this model not tell you? · How Radius helps · FAQ
It is the second week of the budget round at a staffing agency. The operations lead is explaining why one branch needs another recruiter. Candidates wait days for a call. Documents are requested twice. Starters begin later than the client wanted.
The finance director listens, then asks one question: "What does this cost us?"
Nobody in the room has a number. The cost is real, but it is split across recruiter timesheets, a drop-out list and the client's overtime bill. Nobody has ever added the three together.
This scene is a composite, not a documented case.
This article shows how to answer her question with figures you already track: what to count, how to calculate the cost of slow hiring line by line, and the rules that keep the result honest enough for a finance director to use.
What exactly are you putting a price on?
The avoidable cost of the gaps between hiring steps, not a hire.
Radius Hire's 2026 research paper on frontline hiring handoffs defines a hiring handoff as any moment a candidate, or information about a candidate, is passed from one person, team, system or company to another. The recruiter (at a Dutch staffing agency, the intercedent) passing a candidate to the planner is a handoff. So is the agency passing a new starter to the client site. In this article, the cost of slow hiring means the time and work lost at these moments, not the time spent doing each step.
The word "avoidable" matters. Some handoffs exist for a good reason: a legal check, a second pair of eyes or a real decision. The paper calls these structural handoffs and says to keep them and make them fast. Their necessary cost does not belong in this model.
Why does no report show the cost of hiring delays?
Because the cost lands in three different budgets, and nobody adds them up.
Time to hire and cost per hire add up total days and total cost. In the paper's reading, they do not separate the hours someone spent working on a candidate from the days the candidate spent waiting for the next person. Repeated work disappears into recruiter hours. Replacing a candidate who dropped out looks like normal recruiting.
Late starts land furthest away. The client covers an empty position with overtime, last-minute agency staff or lower output. That cost shows up in payroll and operations, not in the recruitment budget, so recruitment never sees the bill.
How do you calculate the cost of vacancy and slow hiring?
Multiply four things you already track by a price, then add them. The late-start line is the cost of vacancy formula in this model; the other three lines price the work and the candidates lost between steps. This is the paper's model for one role, per month:
| Input | What you count | Where the figure comes from | Measured or estimated |
|---|---|---|---|
| Repeated work | Data typed in, questions asked and checks done more than once | Timed in your own review of real candidate journeys | Hours measured; hourly cost estimated |
| Avoidable drop-outs | Candidates lost after a good screening call, where the recorded reason points to a handoff | Your drop-out list, with reasons | Count measured; hours per replacement estimated |
| Late starts | Shift days between the date the client needed someone and the actual start | The client's request dates and day-one records | Shift days measured; cost per shift estimated |
| Escalations | Manager or planner time spent sorting out handoff problems | Timed in your review, or estimated | Measured or estimated; say which |
Illustration built for this article, not client data.
Two pricing choices make a big difference:
- Hourly cost is the cost of the person doing the work, including employer costs, not their gross wage alone.
- The cost of a late start is the extra cost of covering the shift with overtime or agency staff, or the output you lose. It is not the starter's full wage. The paper's example prices it this way.
What does the worked example look like?
Every number here is an assumption, chosen to show how the model works. None of it describes a real agency or site.
In the paper's illustrative example, one site hiring 40 order pickers a month loses €6,140 a month, or €73,680 a year, to repeated work, avoidable drop-outs and late starts. It is not a Radius Hire customer result, a benchmark or a forecast.
| Line | Assumed inputs | Calculation | Per month |
|---|---|---|---|
| Repeated work | 40 hires; 2.5 hours per hire; €35 an hour including employer costs | 40 × 2.5 = 100 hours × €35 | €3,500 |
| Avoidable drop-outs | 8 a month after a good screening call; 3 hours to replace each; €35 an hour | 8 × 3 = 24 hours × €35 | €840 |
| Late starts | 10 starters a month; 3 days late; €60 extra per shift to cover | 10 × 3 = 30 shift days × €60 | €1,800 |
| Total | Escalations and advertising set to zero | €3,500 + €840 + €1,800 | €6,140 a month; × 12 = €73,680 a year |
Illustration built for the paper, not client data. Every input is an assumption.
The example makes four simplifications, and the paper states each one:
- Each shift day is counted once, whether the delay came from a slow handoff or a replacement hire.
- It assumes one shift per starter per day.
- €60 is the extra cost of covering a shift, not the full wage.
- Manager time on escalations and advertising costs are set to zero, to keep the example simple.
The three parts can overlap, and not every agency can win all of them back. The model shows where to look, not what you will save.
Is €73,680 the cost of a hire?
No, it is a yearly process cost in an invented example. It covers avoidable losses between hiring steps, for one role at one site. It is not a typical figure for a staffing agency either.
A separate Radius Hire article, The Cost of a Frontline Hire in the Netherlands: A Model Using Your Own Figures, answers a different question. It models what one frontline seat costs an employer in labour, and what one early exit can cost. Its figures describe one seat or one person. The figure in this article describes the gaps in a process.
The two figures are built from different inputs for different decisions. Do not compare them, and do not add them together. The overtime that covers an empty seat could end up counted in both.
How do you put in your own figures?
Replace every assumption with a figure from your own records, line by line. Use this sheet for one role at one site. Lines G and H on their own give the cost of vacancy (G × H); the full sheet gives the cost of slow hiring.
| Line | What to enter | Your figure | Type |
|---|---|---|---|
| A | Hires per month for the role | Measured | |
| B | Hours of repeated work per hire | Measured in your review | |
| C | Hourly cost of the person doing that work, including employer costs | Estimated from payroll | |
| D | Avoidable drop-outs per month | Measured (count, with recorded reason) | |
| E | Hours to find and screen one replacement | Measured or estimated | |
| F | Advertising cost per replacement, if any | From your invoices | |
| G | Shift days lost to late starts per month | Measured | |
| H | Extra cost of covering one shift (overtime, agency cover or lost output) | Estimated with the site | |
| I | Manager or planner hours spent on handoff problems per month | Measured or estimated | |
| J | Hourly cost of that manager or planner, including employer costs | Estimated from payroll |
Fill-in sheet built for this article.
Monthly cost = (A × B × C) + (D × E × C) + (D × F) + (G × H) + (I × J)
Yearly cost = monthly cost × 12
As a check, the worked example fits this sheet: A 40, B 2.5, C €35, D 8, E 3, F €0, G 30, H €60, I 0 (so J drops out). That gives €3,500 + €840 + €0 + €1,800 + €0 = €6,140 a month.
If different people do the repeated work, price each person's hours at their own cost.
The measured lines come from timing real candidate journeys. The paper suggests one role, one site and 20 to 30 candidate journeys, including people who started, people who dropped out and no-shows, timed over about two weeks. How to map your recruitment process in two weeks sets out that method step by step.
Two more items in the paper's cost table need care:
- No-shows on day one. Price them as empty shifts, plus the time to replace the person. If a no-show is already in your drop-out count, do not count it again. For who pays when a starter does not arrive, see employee no-shows and late starts.
- Copies of ID documents. These are not a cost. Count the places where a copy is kept, and aim to reduce that number.
What rules keep the figure honest?
Five rules, each taken from the paper. The first three come from its cost section, the fourth from its notes for finance teams, and the fifth from its definition of an avoidable drop-out.
1. Count each cost once. A late start and the overtime that covers it are one cost, not two. A no-show counted as a drop-out is not counted again. Planner time counted as repeated work is not counted again as an escalation.
2. Compare like with like. Busy periods, such as the peak before Christmas, change waiting times on their own. Compare a period with a similar one.
3. Price one fix at a time. Say merging two steps saves one 15-minute planner call per hire. At 40 hires a month, that is 10 hours a month. That is arithmetic on your own data, not a forecast. At the €35 an hour assumed in the paper's example, 10 hours would be €350 a month, before you subtract what the change cost.
4. Keep measured figures apart from estimates. Timestamps and counts are measured. Hourly costs and the cost of covering a shift are estimates. Label which is which in every line, so whoever reads the total knows how firm each part is. If the total rests mainly on estimates, say so.
5. Count only avoidable drop-outs. A drop-out belongs in the model only if its recorded reason points to a handoff, such as days without contact or a document request nobody followed up. Candidates also leave for reasons no agency controls, like a better offer or a change at home. Those stay out.
How do you show whether a fix paid off?
Measure twice, then subtract the cost of the fix.
Value of a fix = cost before, minus cost after, minus what the fix itself cost
Measure both times with the same method, on the same number of candidates and in a comparable period. The paper suggests measuring again 30 days after the fixes go live. If a fix does not move the waiting time or the drop-outs at the second measurement, stop it and try the next handoff on your list.
This is a check on a fix you have already made, using measured before and after figures. It is different from the break-even check in the per-hire cost article, which asks how many early exits a planned change must prevent to pay for itself.
Before you redesign anything, check that the handoff is really the cause of the delay. A long wait can also mean someone is simply overloaded, so check workload first.
What does this model not tell you?
It leaves out hard-to-price costs and cannot predict savings.
- Costs that are hard to price are left out, such as your reputation as an employer.
- It is not an outcome measure. It does not replace measures such as retention at 90 days. For those, see How to Measure Quality of Hire in Frontline Recruitment: 10 Measures Across Outcomes, Process and Fairness.
- There is no outside benchmark to check it against. No published study found for the paper measures handoff losses directly in Dutch or European frontline hiring. Your own before-and-after figures are the only comparison that counts.
How Radius helps
Radius Hire is an AI hiring platform for frontline roles, built in Amsterdam for staffing agencies and employers who hire for the work floor. It is built to source, interview and verify applicants, while a person makes every hiring decision.
For pricing delays, the Radius ATS is built to report time to hire, drop-off and cost per hire per role, site and source, which gives you several of the counts this model needs in one place. It keeps one pipeline from applied to signed and can run alongside an existing ATS. The prices, and the decision on what to fix, stay with you.
FAQ
How do you price an unfilled shift?
Price it at the extra cost of covering it, not the starter's wage. That means overtime, last-minute agency staff, or the output the site loses when the position stays empty. Agree the figure with the site that pays it, and label it as an estimate. Pricing the full wage would overstate the cost, because that wage is not paid while the seat is empty.
Should you put a price on waiting time?
No, not on its own. Waiting costs money through the late starts and drop-outs it causes, and those are already in the model. Pricing the waiting days as well would count the same loss twice. Measure waiting time to find where to act, then price its effects.
Is the cost of slow hiring the same as cost per hire?
No, cost per hire averages your total recruiting spend over the people you hired. It does not show hours lost to repeated work, candidates who dropped out between steps, or overtime at the client site. Radius Hire calls this avoidable cost of passing candidates and their details between people, teams, systems and companies the Handoff Tax.
How often should you recalculate the cost of hiring delays?
Recalculate after each fix, and compare like periods. The paper suggests measuring again 30 days after a fix goes live, on the same number of candidates. Seasonal peaks change waiting times on their own, so compare December with a previous December, not with a quiet spring month.
How do you calculate the cost of vacancy?
In this model, the cost of vacancy is the late-start line: shift days not covered because a starter began late, times the extra cost of covering one shift with overtime, agency cover or lost output. In the worked example, that is 30 shift days × €60 = €1,800 a month. The full model adds repeated work, avoidable drop-outs and escalations, so the cost of slow hiring is wider than the cost of vacancy alone. Count each cost once.
Sources
- Radius Hire (2026). The Radius Papers 02: The Hidden Cost of Frontline Hiring. White paper. https://radiushire.com/white-papers/radius-papers-02.
Written by the Radius Hire team. Sources checked on 19 October 2026.