
For the wider set of measures a frontline report can carry, see how to measure quality of hire in frontline recruitment.
On this page: What should a recruitment report include besides time to hire? · How do you fill in the report without new software? · Why does measuring the wait work? · What mistakes make a recruitment report misleading? · What does this look like in a branch? · How Radius helps · FAQ
What should a recruitment report include besides time to hire?
Keep time to hire, and add measures that show where the time and the candidates go. The first three rows draw on the measures in Radius Hire's 2026 research paper on frontline hiring handoffs; the layout is ours.
| What to report | How to work it out | Measured or estimated | What it tells you |
|---|---|---|---|
| Median waiting time per handoff, with the worst case beside it | For each gap (screening to planner, planner to administrator, approval to contract), the middle value of the days between sending and first action | Measured, from timestamps | Which gap holds the most waiting |
| Where drop-outs happened | Count candidates who left between each pair of steps, with the reason where one was recorded | Measured | Whether candidates leave at the same gap where they wait |
| Late starts and day-one no-shows | Shift days between the date the client needed someone and the actual start; planned starters who did not arrive | Measured | What the delay costs the site |
| Touch time per step | Ask the person who did the work how long it took | Estimated | How much of the total is work and how much is waiting |
| Time to hire | Days from application to start, as today | Measured | Whether the process is slow overall |
Report layout built for this article, not client data.
Two of these rows have their own articles: candidate drop-off covers where candidates leave between steps, and employee no-shows and late starts covers what an empty shift costs the site.
How do you fill in the report without new software?
Use the records you already have, for one role at one site.
- Pick 20 to 30 recent candidate journeys. The paper says that is enough to start seeing patterns. Include people who started, people who dropped out and no-shows.
- Collect the timestamps. Your applicant tracking system (ATS) records stage dates. Emails and WhatsApp messages carry their own times. Planners' lists show when a candidate was picked up.
- Time each handoff. Note when it was sent and when the next person first acted on it. The gap is the waiting time.
- Ask about the work. Ask the person who did each step how long it actually took. That is the touch time.
- Take the median for each handoff. Put the worst case next to it.
For the full method, see how to map your recruitment process in two weeks.
What does a simple recruitment report template look like?
One page for one role at one site, with a row for each handoff. The handoffs below are the ones named above; replace them with your own.
| Handoff | Median wait (days) | Worst case (days) | Drop-outs at this gap | Reason recorded |
|---|---|---|---|---|
| Screening to planner | ||||
| Planner to administrator | ||||
| Approval to contract |
Fill-in template built for this article.
Under the table, add one line each for late starts (in shift days), day-one no-shows (as a count), touch time per step (labelled as an estimate) and time to hire (as today).
The figures show patterns, not precise rates. Once you know which gap matters, decide whether to track it routinely, for example on a recruitment dashboard.
Why does measuring the wait work?
Because totals hide the gaps. Waiting time is the time between passing something on and the next person first acting on it. Touch time is the time someone actually spends working on the candidate. Both definitions come from the paper.
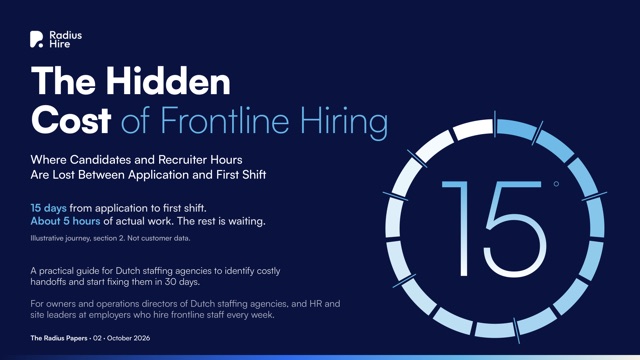
The two can be far apart. In the paper's illustrative journey, one hire took 15 days from application to first shift, and the actual work added up to about five hours. The example is invented, not client data, but it shows how much a total can hide. Factories learned this long ago: the Toyota Production System counts waiting, and moving work from place to place, among its forms of waste (Ohno, 1988).
The wait matters because frontline candidates still have options. At the end of June 2026 there were 95 open vacancies for every 100 unemployed people in the Netherlands, according to preliminary figures from Statistics Netherlands (CBS, 30 July 2026). A candidate who waits days for a call may not keep waiting.
There is a second blind spot. Your Hiring Is Not Too Fast. Your Evidence Arrives Too Late. argues that time to hire shows when a team decided, not what it knew at that point. That article is about when evidence reaches the decision. This one is about where the days go between steps.
What mistakes make a recruitment report misleading?
- Reading time to hire as a diagnosis. It tells you whether something is wrong, not where. Fix: add a figure for each handoff.
- Reporting one total for the branch. Fix: report one role at one site at a time.
- Using the average. One candidate who waited three weeks distorts it. Fix: use the median and show the worst case beside it.
- Mixing measured and estimated figures. Fix: label timestamps and counts as measured, and hourly costs and "about 20 minutes" as estimates.
- Treating short touch time as the goal. A screening call that takes 20 minutes because the recruiter asks good questions is time well spent. Fix: look at what happens after the call ends.
What does this look like in a branch?
Every Monday morning, a branch manager in Rotterdam opens last week's report. 120 applications. 60 screening calls. 25 interviews. 14 placements. The screening pass rate is better than last month.
Then a client calls. Two starters they expected on Monday are not coming. One took another job last Thursday. The other was still waiting to hear about shifts. Neither of them appears anywhere in the report, because each number describes a stage and none shows the days between them.
This scene is a composite, not a documented case.
How Radius helps
Radius Hire is an AI hiring platform for frontline roles, built in Amsterdam for staffing agencies and employers who hire for the work floor, and a person makes every hiring decision. The Radius ATS runs one pipeline from applied to signed for every role and site, and is built to report time to hire, drop-off and cost per hire per role, site and source.